

Reports
Every report in one place, from top customers and sales trends to sales by area, pipeline, reviews and on-time arrivals.
Reports turns your event sales into answers: who your best customers are, which months and places pay, how fast leads turn into bookings, and whether your trucks arrive on time. Open it from Reports in the sidebar.
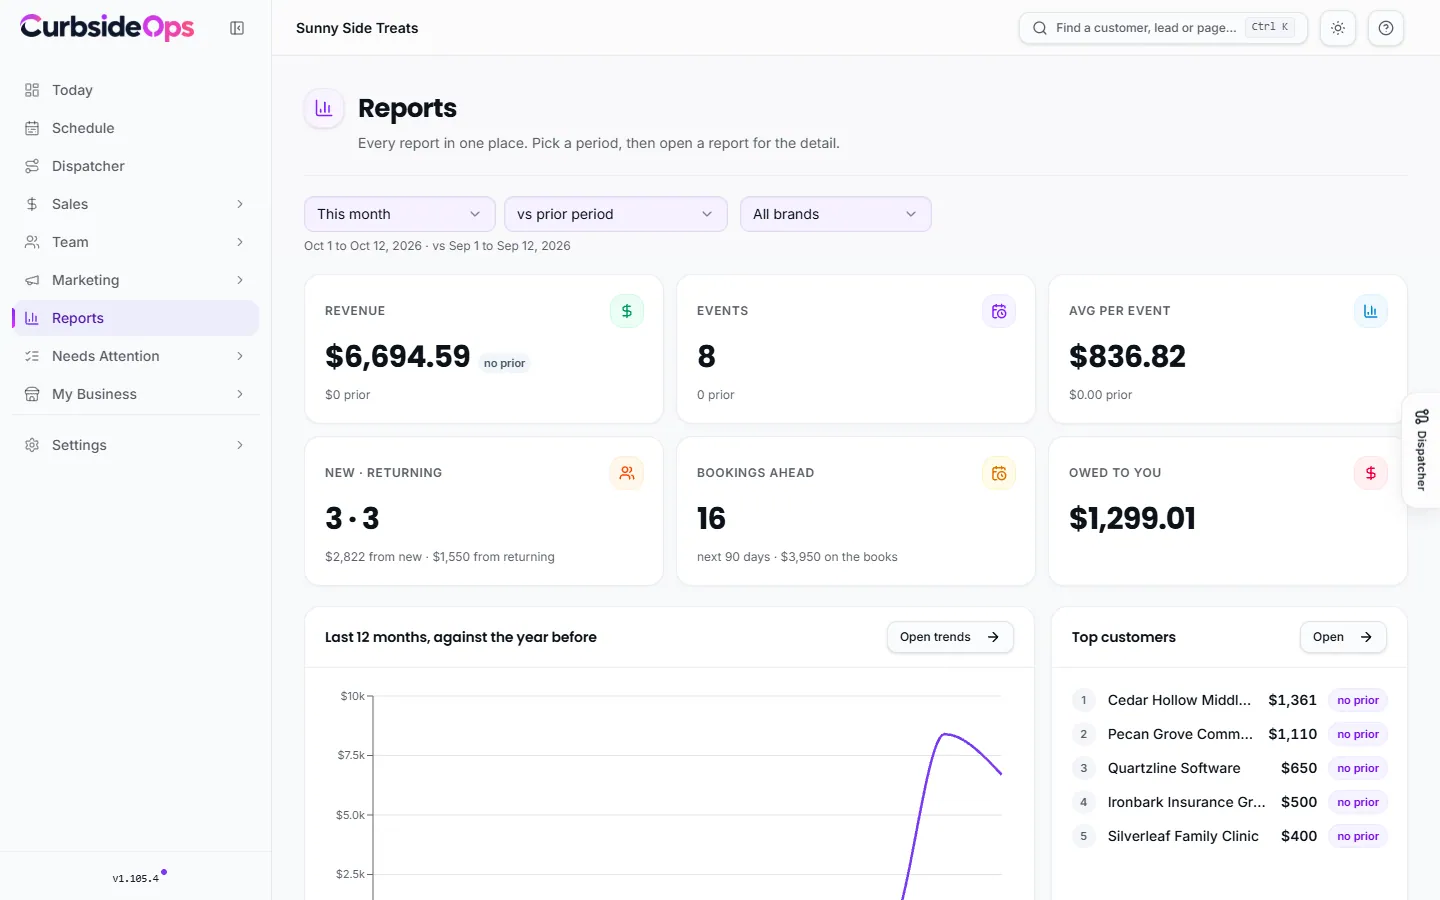
The hub
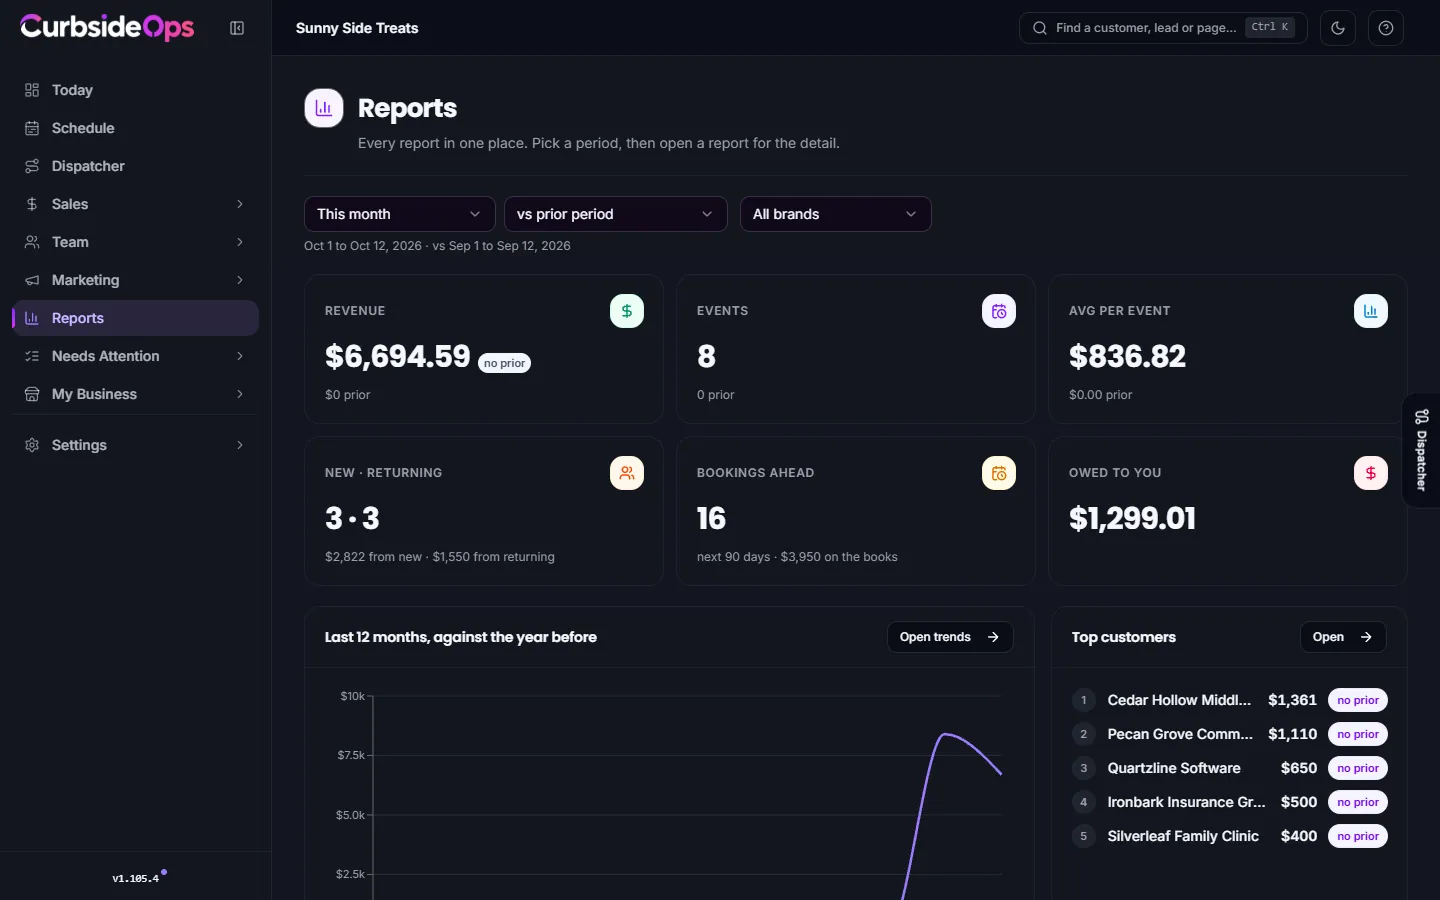
The top of the page is a summary for the period you pick: Revenue, Events, Avg per event, New · returning customers, Bookings ahead, and, for people who can see finances, Owed to you. Below it are the last 12 months against the year before, your top customers, and (on Professional and up) your top areas and sales by category.
Under that, every report is a card, grouped into Customers, Sales, Money and Operations. A card your plan does not include shows a lock and See plans.
Periods and comparisons
Every report has the same two controls:
- Period: today, yesterday, the last 7, 30 or 90 days, this or last week, month, quarter or year, the last 6, 12 or 24 months, or a Custom range.
- Compare: No comparison, vs prior period or vs same period last year. "This month" compared with the prior period means the 1st to today against the same days last month, so a half-finished month is never compared with a whole one.
Dates follow your business's time zone. Pick a brand with All brands to see one brand only. The address bar holds the whole view, so you can bookmark a report or send the link to a manager.
The reports
| Report | What it answers | Plan |
|---|---|---|
| Top customers | Who paid you the most, by customer, organization or person, and how often. | Every plan |
| Sales trends | Revenue by month or week (by day of week or hour of day on Professional). | Every plan |
| Pricing mix | Revenue by arrangement: menu, package or minimum (by template or package on Professional). | Every plan |
| Payment mix | Cash, card, check, invoice and pre-paid money as a share of what came in. | Every plan |
| New vs returning | How much came from first-time customers and how much from people who came back. | Every plan |
| Sales report | Daily, weekly and monthly sales with the brand mix. | Every plan |
| Givebacks | What your events owed schools, PTOs, venues and charities, and what you paid. | Every plan |
| Sales by category | Which kinds of organizations book you: schools, churches, corporate and the rest. | Professional |
| Sales by area | Where your events happen, by ZIP code, city or state, or where your customers are based. | Professional |
| Sales by truck | What each truck earned and how many events it worked. | Professional |
| Win-back list | Customers who booked in this window last year and have not come back. | Professional |
| Money owed to you | Every open invoice by how late it is. | Professional |
| Lead pipeline | Inquiries to bookings by stage and channel, response time, and why leads were lost. | Professional |
| Pre-pay orders | Orders, revenue and top items across your pre-pay events (shown when your account uses Pre-Pay Orders). | Professional |
| Reviews | Review requests sent and answered, the average rating, and low scores to follow up. | Professional |
| On-time arrivals | How often your trucks arrive on time, by month and crew member. | Professional |
| Marketing output | Drafts the AI produced and how many went out. | AI Marketing |
| Profit and loss | Revenue against labor, mileage, fees and overhead. | Premium |
The money reports are explained in Money reports, and the P&L in Profit and loss.
Breakdowns and the map
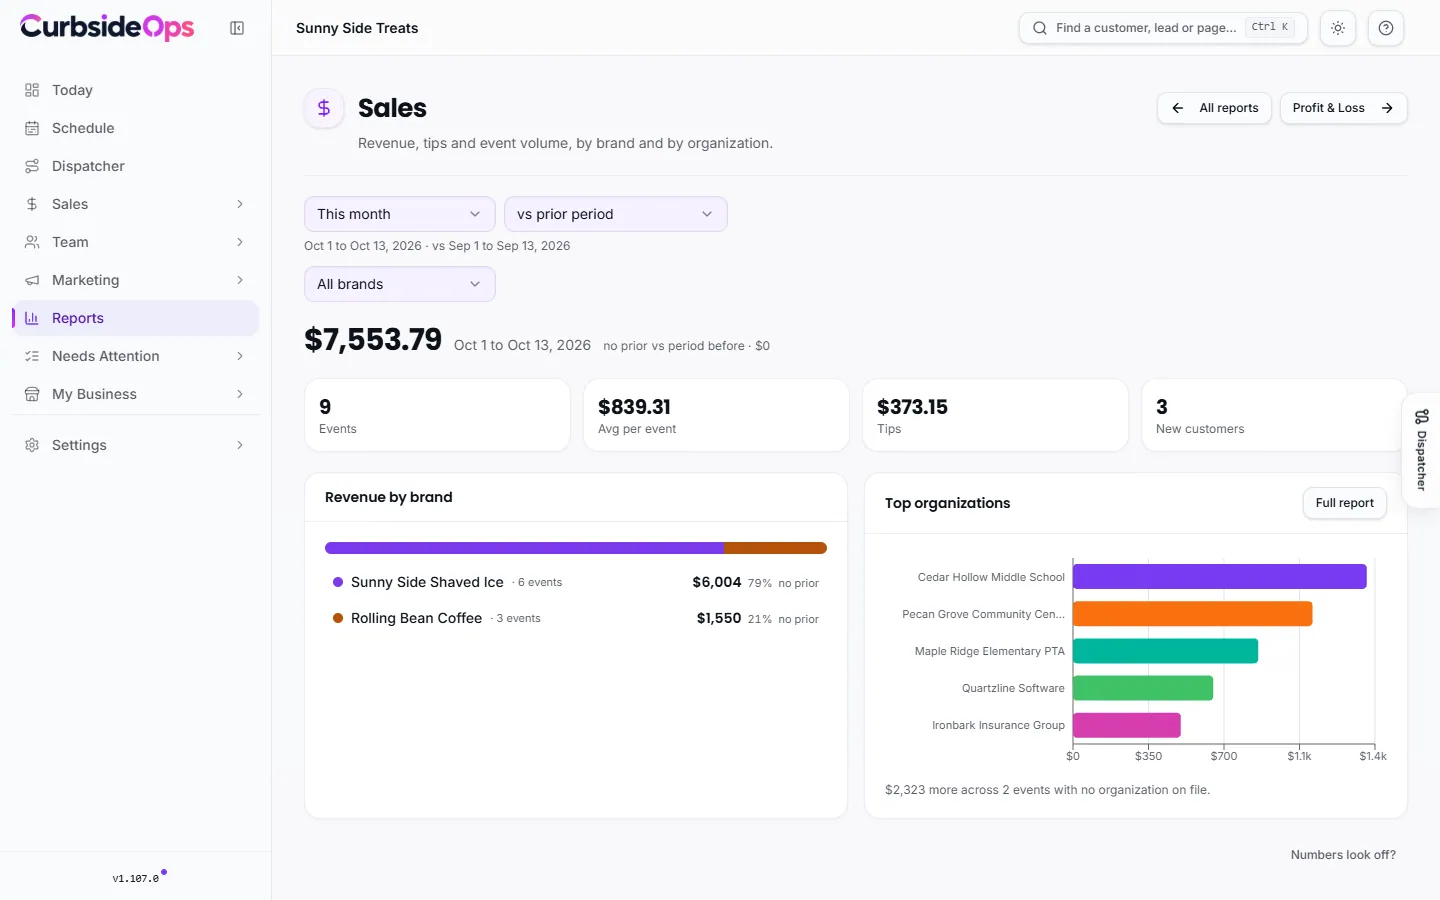
Breakdown reports group your sales one way at a time, with a chart and a table of revenue, events, average per event and the change against your comparison. On Starter you can group by brand, time, customer, organization, person, arrangement, payment method and status; Professional adds day of week, hour, category, ZIP, city, state, truck, pricing template and package.
Sales by area can follow Where events happen or Where customers are. On the first, On the map shows each area as a bubble sized by revenue.
Sales by category uses the category on each organization (School, Church, Corporate and so on). A customer with no organization reports as "No organization", and an organization with no category as "Uncategorized". Fix that from Organizations.
Export CSV downloads what you are looking at.
Notes on a few reports
- Win-back list: customers who booked you in this window last year and have not booked since. Follow up adds a reminder to your follow-ups; nothing is sent to the customer.
- New vs returning counts a customer (the organization, else the person) as new when their first event falls in the period.
- On-time arrivals compares each truck's real arrival (from GPS or recorded on the job) with the scheduled start, never clock-ins, since crews clock in at base well before they leave. Jobs with no arrival time are left out, and the page says how many were measured.
- Marketing output is part of AI Marketing (Premium, or the add-on).
Ask the assistant
On Telegram, owners can ask for numbers in plain words: "What did we make last month by brand?", "How did September compare with last year?", "Who were our top customers this year?". The assistant reads the same reports and quotes the figures as they are. See Your AI assistant.
Managers
Managers see Reports too. Fees, payables, take-home, money owed and the P&L need Finance visibility; without it those figures are simply left out. See Managers and permissions.
Still stuck? Email support@curbsideops.com or use Report an Issue in the portal. Checked against CurbsideOps 1.105.4.
Loyalty
A QR code customers scan to sign up for your text updates, a list of who opted in, regulars counted from Square, and win-back texts only to people who said yes.
Money reports
What customers still owe you, what your events owe schools and charities, and what guests pre-paid, plus who on your team sees the money.