

Profit and loss
Month-by-month revenue, costs and margin for each brand and the whole business, built from your closeouts.
Sales tell you what came in. The Profit & Loss report tells you what you kept: each month's revenue against the labor, mileage, fees and overhead it took to earn it, by brand and for the whole business. Open it from the Profit and loss card on Reports.
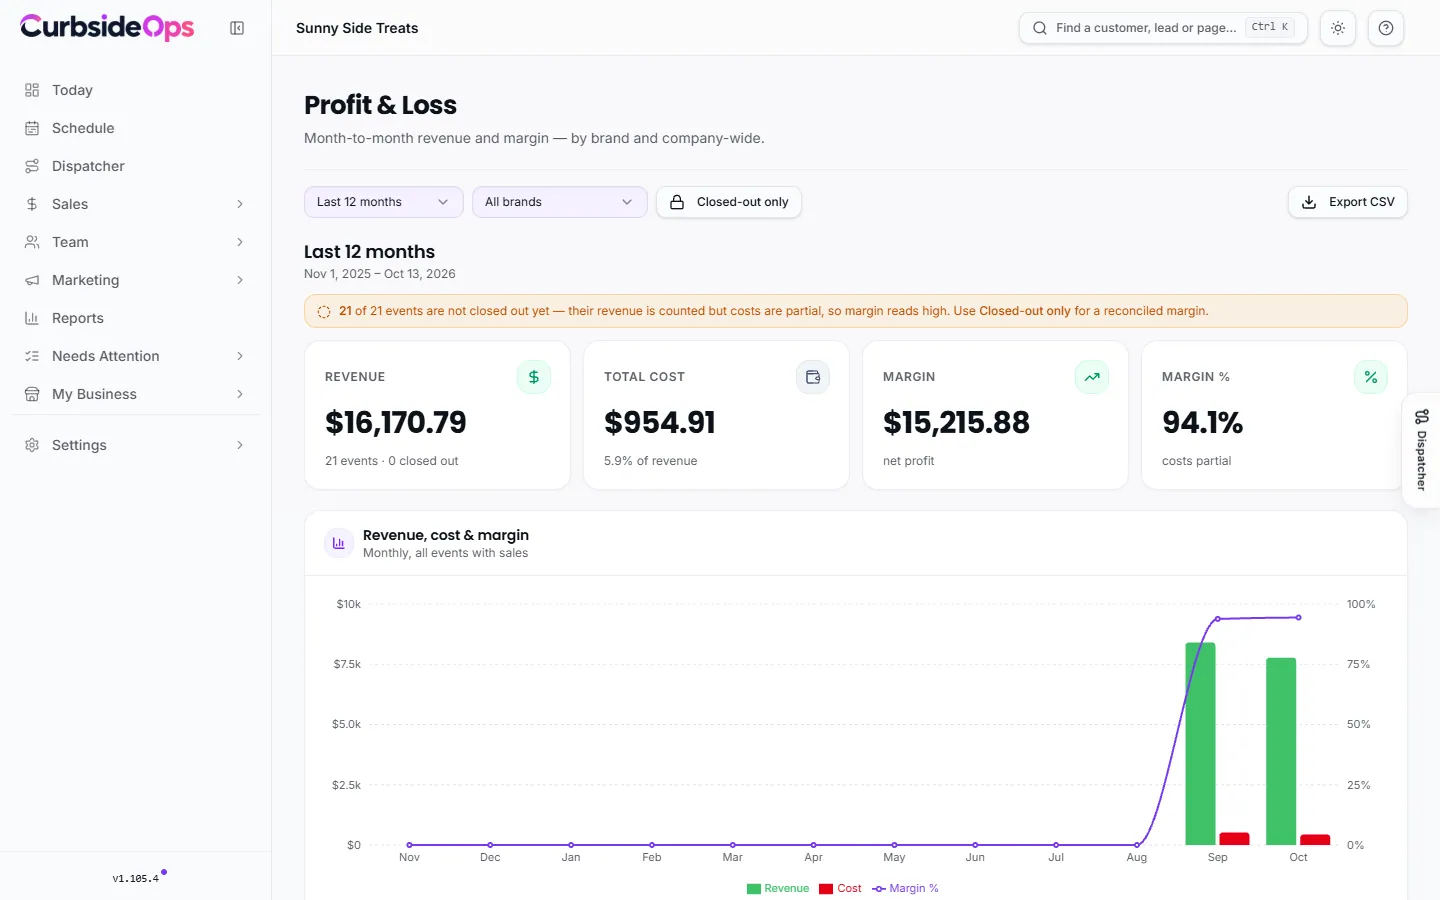
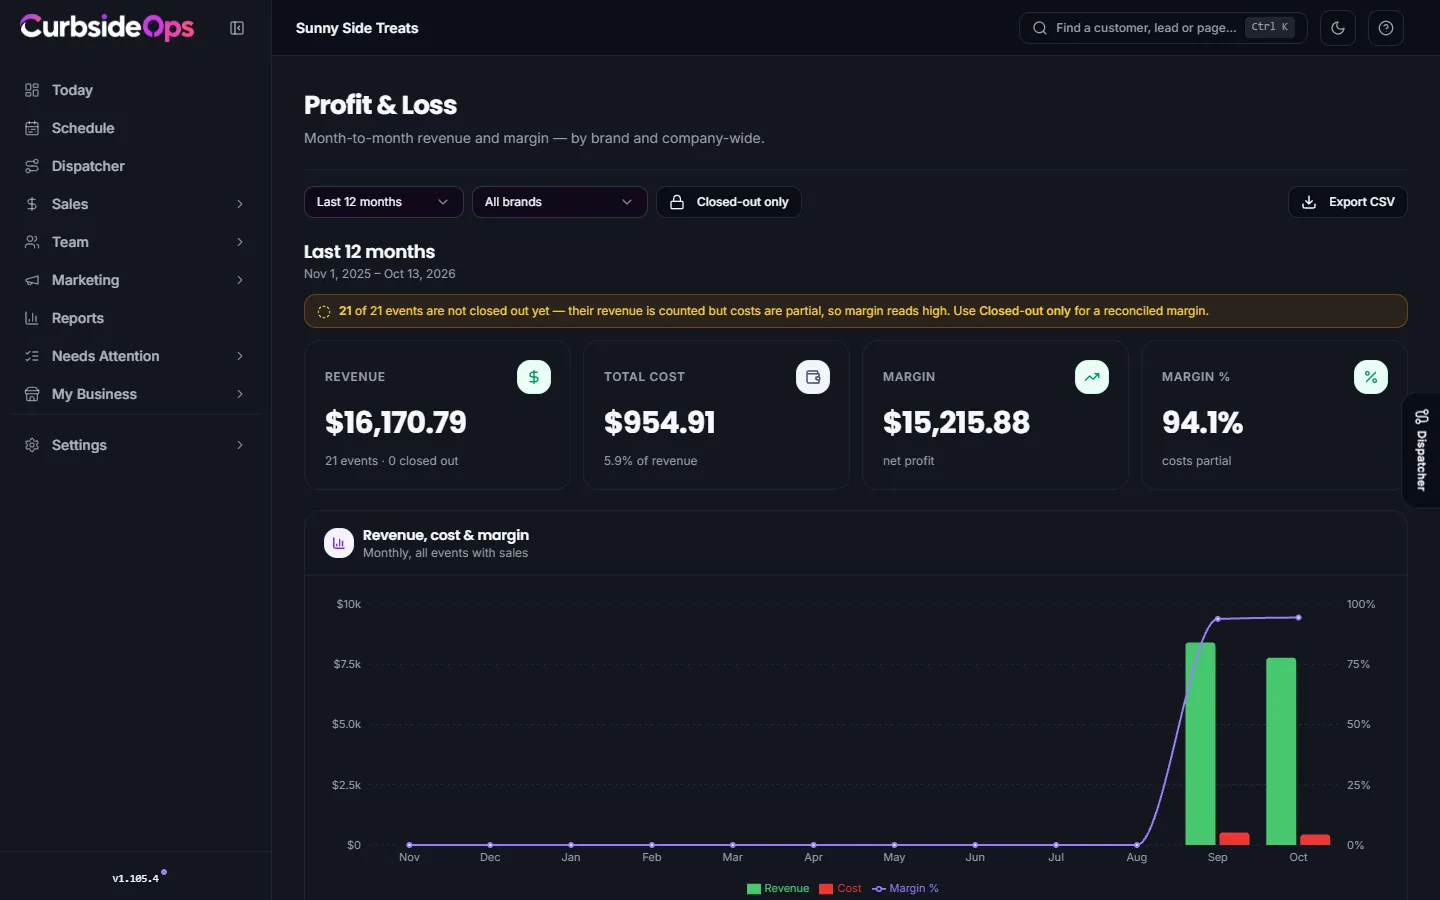
Reading the page
Pick a period (this or last month, quarter or year, or the last 6, 12 or 24 months) and All brands or one brand. The top row shows:
- Revenue, with how many events it covers;
- Total cost, and what share of revenue it is;
- Margin: net profit or net loss;
- Margin %, and whether it rests on actual numbers, estimates, or partial costs.
Below it:
- Revenue, cost & margin: month by month, by brand and company wide.
- Where the money goes: each month's costs split into Labor, Mileage, Square fees, Venue & event fees and Overhead.
- Margin by brand and the By brand table, so you can see which brand carries the business.
Tap a month on the chart to see just that month. View as table shows the numbers instead of the chart. Export CSV downloads it.
What it counts
Revenue is each event's sales without the sales tax and tips you pass through, plus any booking fee. It is the same revenue figure the rest of Reports uses, so the two agree to the cent. A cancelled event counts only the cancellation fee you kept.
Costs come from two places:
- From the event's sales: Square fees on its payments, and Venue & event fees, the share you owe a school, venue or charity (see Givebacks).
- From the event's closeout: Labor (timecards inside the event window plus 30 minutes each side, at each person's hourly cost), Mileage and Overhead. See Jobs and closeout.
An event appears once it has sales or a closeout. Events with neither are left out rather than padding the report with empty rows.
Closed-out only
An event that is not closed out yet has its revenue but not its labor, mileage or overhead, so the margin reads high. When that is the case, the page tells you how many events are still open and Margin % says the costs are partial.
Switch on Closed-out only to count just the events with a locked closeout, where revenue and costs have both been reconciled. That is the number to trust for a month you have finished closing.
Estimates are marked
Some closeouts lean on an estimate, for example mileage from the route when no GPS trips were recorded. Margin % tells you how many events used one, so you know how firm the number is.
Plans and access
The month-by-month P&L and its CSV are part of Premium. On Professional, each job's closeout already shows that one event's revenue, costs and margin.
Managers need Finance visibility to open the P&L. See Money reports.
Still stuck? Email support@curbsideops.com or use Report an Issue in the portal. Checked against CurbsideOps 1.105.4.